
What is anomaly detection?
What is anomaly detection?
Anomaly detection is the process of finding unusual patterns or behaviors in data. These patterns are different from what we expect to see. Anomaly detection helps stop fraud, fix system issues, and catch security threats before they cause damage.
In simple terms, it means finding data points that do not match the normal pattern. These unusual points, called outliers, can show early signs of problems or attacks.
Anomalies can happen because of fraud or cyberattacks. They can also come from system errors or random issues. That is why detecting them early is important.
AI-based systems help by learning what normal data looks like. Then, they find patterns that are far from normal. This helps businesses find rare or new issues in finance, healthcare, security, and more.
To train these AI-based systems, many companies now use synthetic data for anomaly detection. It helps generate rare and realistic examples of unusual behavior without using sensitive data.

Why is anomaly detection matters?
Anomaly detection helps businesses protect their operations and make better decisions. By finding unusual patterns in data, they can catch problems early before they grow.
This early action prevents system failures and keeps data safe. It also helps ensure data is clean, which leads to more accurate analysis and smarter choices.
In finance, anomaly detection finds fraud and protects money. In factories, it can spot machine issues early and reduce downtime. In healthcare, it helps doctors catch health problems faster and treat patients sooner.
It also improves data quality by finding and fixing errors. This is important for building strong AI models and reducing risks in business.
Using anomaly detection helps companies work better, safer, and smarter in the long run.
How accurate is anomaly detection?
Anomaly detection accuracy depends on several factors. These include the technique used, the amount and quality of data, and the specific business environment. Simple methods, like rule-based or statistical approaches, are easy to apply. However, they often lack accuracy with complex or noisy data.
Modern AI-based methods, such as Isolation Forest, One-Class SVM, and autoencoders, can detect more subtle patterns. These models learn from data and find behaviors that differ from the norm.
Even advanced models are not perfect. One major issue is false positives. This means the system marks normal data as abnormal. Too many false alerts can cause users to ignore warnings. Also, many datasets lack labeled anomalies, which makes training difficult.
To measure accuracy well, we need more than detection rate. Useful metrics include precision, recall, and the F1 score. These show how well the system finds real problems and avoids mistakes. In datasets where anomalies are rare, these metrics are especially helpful.
| Metric | Definition | Why It Matters |
| Precision | Proportion of true anomalies among all detected anomalies | Reduces false positives; useful in fraud, security alerts |
| Recall | Proportion of actual anomalies that are correctly detected | Reduces false negatives; critical in healthcare and safety |
| F1 Score | Harmonic mean of precision and recall | Balances precision and recall; preferred in imbalanced data |
| False Positive Rate | Ratio of normal instances incorrectly flagged as anomalies | Lower FPR improves trust and minimizes unnecessary responses |
In the end, accuracy should consider false positives, how easy the system is to understand, and how well it adapts to new data.
What are the three types of anomaly detection?
Anomalies in data can show up in different ways. Based on how they appear, we can group them into three main types: point anomalies, contextual anomalies, and collective anomalies.
Knowing these types helps us choose the best way to detect them. It also improves the accuracy of the system.
1. Point Anomalies
Point anomalies happen when one data point is very different from all the others. This is the simplest and most common type of anomaly. It is often called an outlier.
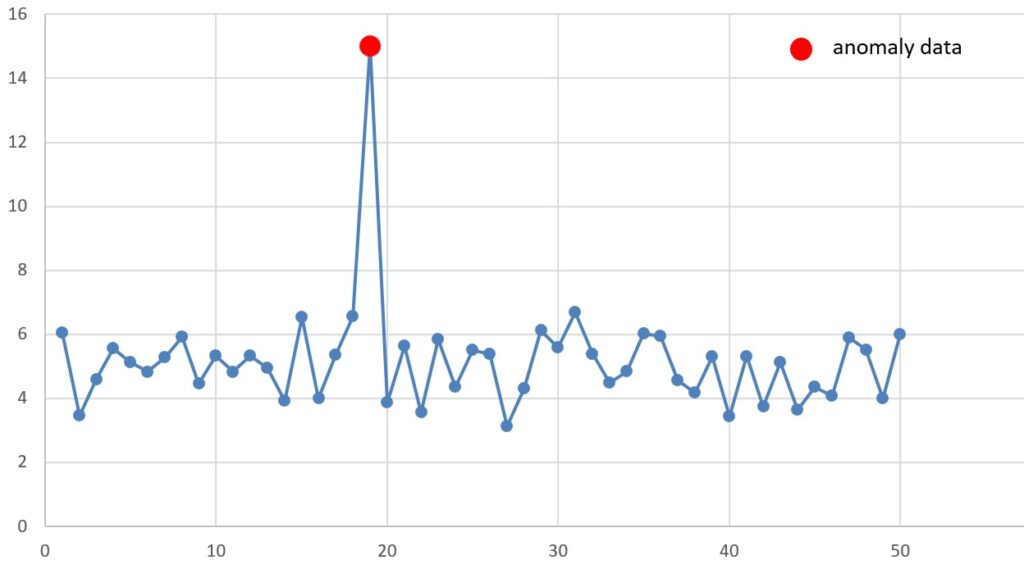
Example:
In a warehouse, the normal temperature in a cold storage unit is between 2°C and 8°C. If one reading shows 80°C, it is a point anomaly and may mean the system is broken.
2. Contextual Anomalies
Contextual anomalies happen when a value is only unusual in a certain situation. In other situations, it may be completely normal. These types of anomalies depend on context like time, location, or conditions.
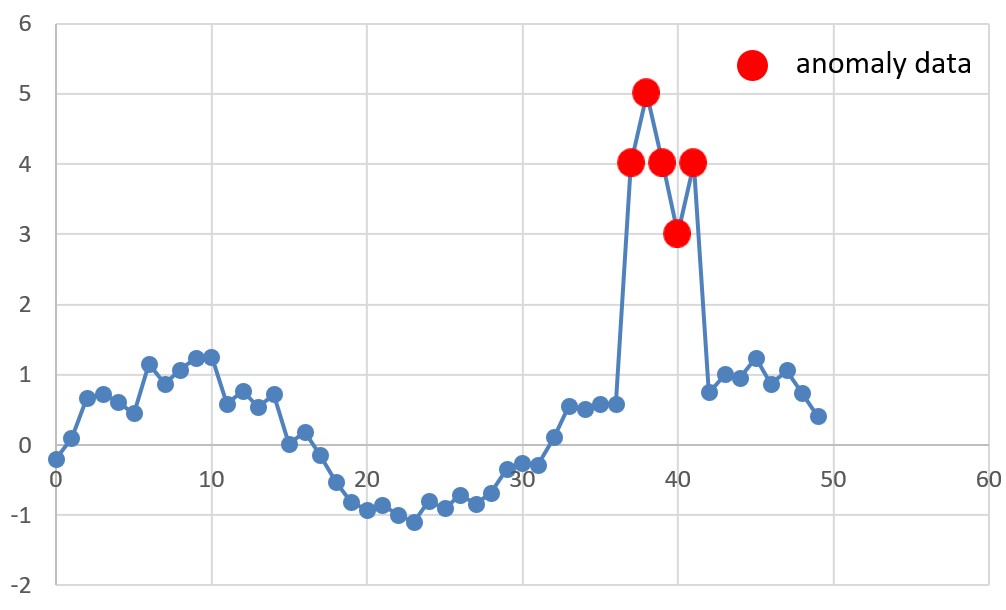
Example:
A temperature of 30°C might be normal in summer, but the same temperature during winter in a cold region would be a contextual anomaly.
3. Collective Anomalies
Collective anomalies are when a group of data points seems normal one by one, but unusual when seen together. These patterns often appear in time-series or sequence data.
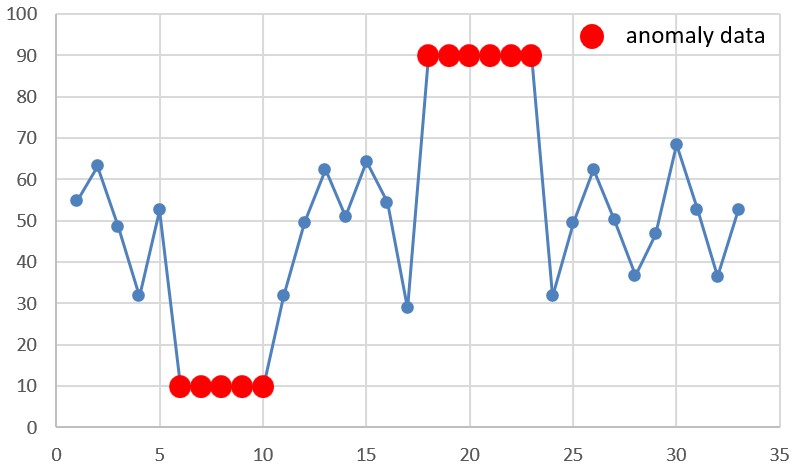
Example:
If several machines in a factory start showing a slow increase in vibration over time, each reading may look fine. But together, they may signal an upcoming failure.
Anomaly detection methods: Which techniques are used?
Anomaly detection can be done in different ways. The best method depends on the data type, the industry, and how complex the patterns are. The right choice affects both accuracy and how well the system scales.
There are three core techniques for anomaly detection. Each has its own strengths, limitations, and use cases. Here’s a quick overview before we explore each in detail:
| Method Type | Best For | Pros |
| Statistical-Based | Simple, structured data | – Easy to understand – Fast computation |
| Machine Learning | Complex, high-dimensional data | – Learns patterns – Scalable and flexible |
| Rule-Based / Threshold | Real-time alerts, clear rules | – Simple setup – Transparent and controlled |
1. Statistical-Based Methods
These methods use math to describe what is “normal” in the data. They often look at the mean, standard deviation, or variance. If a value is far from normal, it is marked as an anomaly.
This approach works well when the data follows a clear, known distribution like Gaussian. It’s often used in finance, quality control, and sensor monitoring, where thresholds and data behavior are relatively stable.
- Pros
- Easy to understand and explain
- Good for simple, structured data
- Cons
- Not effective with complex or high-dimensional data
- Assumes a fixed distribution
2. Machine Learning Approaches
These methods learn patterns from past data. They are good at finding complex or hidden anomalies.
They work well when anomalies are rare, small, or change over time. Unsupervised models, like clustering or Isolation Forest, do not need labeled data. Supervised models need labels but can be very accurate. Deep learning models, like autoencoders, help find strange patterns in images, videos, or time-series data.
This approach is often used in areas like fraud detection, cybersecurity, machine maintenance, and healthcare.
- Pros
- Handles complex and large data
- Can detect subtle patterns
- Cons
- Needs a lot of data
- Can be hard to explain
- Requires more computing power
3. Rule-Based & Thresholding Techniques
These use fixed rules or thresholds to flag anomalies. For example, if a value goes above a set limit, it triggers an alert.
This method is ideal when domain experts can clearly define what is abnormal. It’s widely used in traditional monitoring systems (e.g., server logs, manufacturing) and in cases where transparency and real-time response are critical. However, it struggles with unknown or evolving threats and doesn’t adapt well to changes in data behavior.
- Pros
- Simple to set up
- Easy to understand and control
- Cons
- Not flexible
- Can miss new or unknown patterns
Examples of anomaly detection: Use Cases
Anomaly detection is used in many industries. It helps find problems in real time or by spotting trends over time. It reduces human effort and improves decision-making by identifying what doesn’t fit the normal pattern.
Below are some of the most common and impactful use cases:
1. Fraud Detection in Financial Transactions
Banks and financial institutions use anomaly detection to prevent fraud. These systems monitor transactions in real time and detect spending patterns that differ from normal user behavior. For example, a sudden large purchase in another country could trigger an alert. This reduces the need for manual reviews and helps protect both the bank and the customer from loss.
2. Network Security & Cyber Threat Detection
In cybersecurity, anomaly detection helps detect threats before they cause damage. It monitors user logins, access behavior, and network traffic. Unusual activities—like repeated login failures, access from unknown devices, or large data transfers—can signal a breach. These systems are essential for catching attacks that don’t follow known signatures.
3. Predictive Maintenance in Manufacturing
In factories, equipment sends constant sensor data such as temperature, pressure, and vibration. Anomaly detection checks for unusual patterns that might indicate wear, misalignment, or early signs of failure. This allows companies to fix machines before they break down, reducing costly downtime and improving safety.
4. Data Migration Integrity Monitoring
Data migration means moving data from one system to another. This is common when switching to a new platform or using the cloud. During this process, it is important to make sure that no data is lost or changed.
Anomaly detection helps by checking for problems. It can find missing records, duplicate entries, or changes that should not happen.
The system compares the data before and after the move. This makes sure the data migration is done safely and correctly.
Using anomaly detection in data migration helps teams avoid costly errors and build trust in their results.
Challenges in anomaly detection
Anomaly detection is important, but it has many challenges. These problems can affect how well the system works in real situations. Solving them is key to building strong and useful models.
1. High False Positive Rates
Many systems mark normal data as an anomaly. This causes too many alerts, wasted time, and less trust in the system.
One reason for this is the lack of anomaly data. Most systems have much more normal data than abnormal cases. Because of this, the system does not learn enough about what real anomalies look like.
To build a good anomaly detection system, we need enough examples of abnormal behavior. Without this, the system may keep making false alarms.
2. Scalability & Real-Time Processing
Modern systems create a huge amount of data every second. Anomaly detection systems need to keep up in real time and still be accurate.
One big challenge is that large data streams require fast and powerful processing. If the system is too slow or too heavy, it can miss real-time alerts or fail to scale with growing data.
To fix this, teams must use efficient pipelines, distributed processing, and lightweight models. These help the system stay fast, accurate, and ready for large-scale use.
3. Evolving Threats & Data Variability
Anomalies are not always the same. New threats appear, users change behavior, and systems evolve over time.
Many models are trained on old data. If they don’t update, they can miss new or unusual problems. This makes them less useful in fast-changing environments.
To stay effective, anomaly detection systems should learn over time. This can be done through regular retraining, feedback from users, or real-time learning methods.
azoo: Scalable Models and Quality Data for Anomaly Detection
azoo helps solve big problems in anomaly detection by using private synthetic data. Many systems struggle with a lack of rare anomaly examples, fast-changing threats, or limited access to real-time data. azoo fixes these issues by generating smart and safe synthetic datasets.
With azoo, teams can build high-quality data that includes many kinds of rare and complex anomalies. This helps models learn better, reduce false alarms, and keep improving over time. There is no need to use real, sensitive, or hard-to-get data.
Because azoo uses private synthetic data, there are no worries about data privacy, legal rules, or ownership issues. That makes it safe and scalable for industries like finance, healthcare, and defense.
- Reduce False Positives with More Anomaly Data
Many systems don’t have enough real anomaly data. azoo can generate many types of synthetic anomaly cases. This helps the model learn and make fewer false alerts. - Scalable Models for Real-Time Processing
Real-time systems produce a lot of data. azoo provides fast and lightweight models trained on synthetic data. These models can be used right away or fine-tuned for finance, healthcare, or manufacturing. - Adapt to Evolving Threats with Custom Synthetic Scenarios
Threats and data patterns change often. azoo generate synthetic data based on new or rare problems. It also helps use private real-time data safely for fast model updates.
Read More : Anomaly Detection Revolutionized: 5 Breakthrough Benefits of Synthetic Data
azoo also runs a data marketplace that offers synthetic datasets free from copyright or privacy issues. These datasets are ready to use and safe for training AI models. If your team needs high-quality data for anomaly detection—or lacks the data to train a model—you can browse and purchase what you need from the azoo Data Market.